

Figure 2a: Probability of Civil War at Low/High Levels of Political Rights and Variable Ethno-Linguistic Fractionalisation
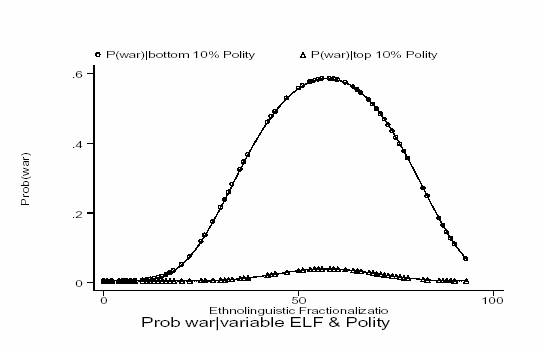
Figure 2b: Probability of Civil War at Low/High Levels of Income and Variable Ethno-Linguistic Fractionalisation
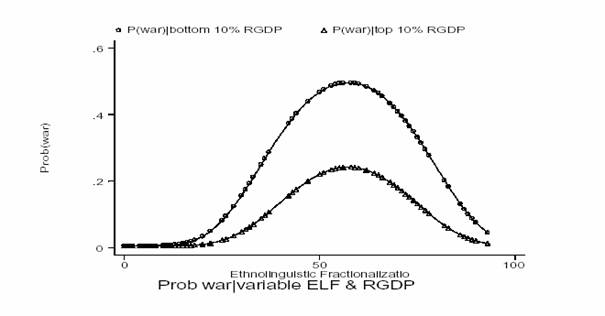
Figure 2c: Probability of Civil War at Low/High Levels of Natural Resource-Dependence and Variable Ethno-Linguistic Fractionalisation
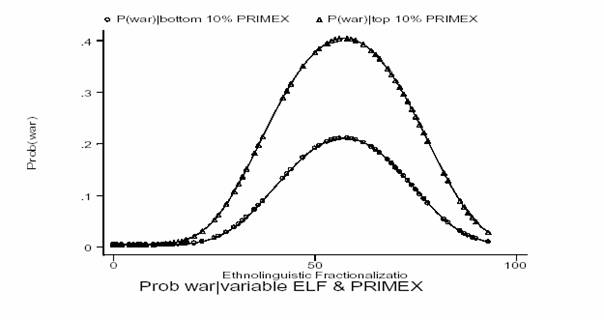
These figures are based on the model in the appendix. The probability of civil war is estimated using a random effects probit and a 5-year panel data-set of 161 countries from 1960-99. Polity is a measure of political rights, ranging from -10 (minimum) to 10 (maximum). RGDP is real per capita GDP, purchasing power parity-adjusted. ELF is the ethno-linguistic fractionalisation index discussed in the text (ranging from 0 in homogeneous societies to 100 in heterogeneous societies). PRIMEX measures natural resource-dependence, proxied by primary exports as percent of GDP. The appendix presents the statistical results for the core model.
Source: Ibrahim Elbadawi and Nicholas Sambanis, Why Are There So Many Civil Wars in Africa?: Journal of African Economies, December 2000.